Brandon, Christian and Jason dive into the market stats for the month of July 2020.
The highlight reel of what is discussed is below, if you’d like to skip to the segment of interest:
2:36 – GTA wide market stats (average home price, new listings, active listings, Toronto unemployment rate, GDP growth, Inflation and mortgage rates.
4:33 – Map outlining area of focus for conversation on ‘downtown’ market areas.
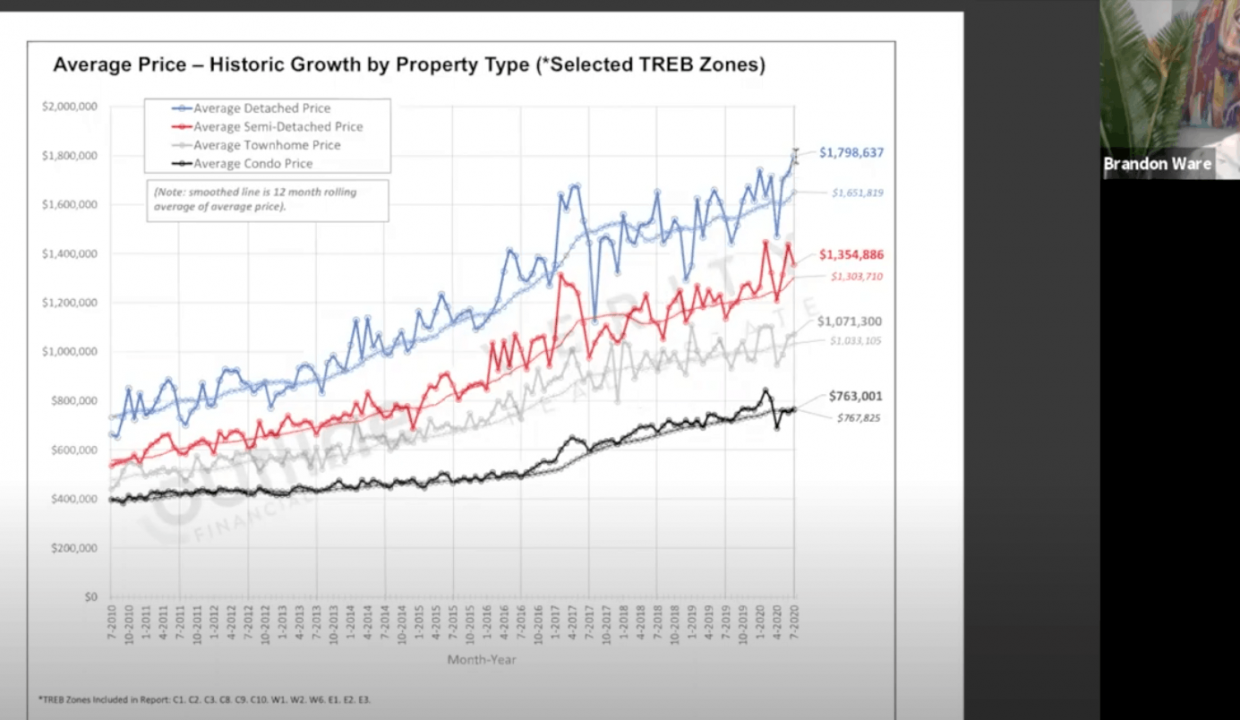
4:45 – Average price growth charts and graphs for housing types (Detached, Semi, Townhouse and condo) including rolling 12 month Average house growth.
5:52 – 15 year average house growth graph (seasonal fluctuations and 12 month rolling averages) – Detached, Semi, Townhouses and Condos).
6:19 – Number of sales – July 2020 versus 2019 and 5 & 10 year averages.
9:00 – New Listings chart – July 2020 versus 2019 and 5 & 10 year averages.
9:11 – Active Listings chart – July 2020 versus 2019 and 5 & 10 year averages.
11:27 – 15 year graph showing 12 month rolling average ‘Months of Inventory’ for Detached, Semi, Townhouses and Condos.
12:55 – Discussion around 2012 mortgage rule changes resulting in condo supply inventory dipping to low levels from 2017 through 2020.
15:20 – Monthly ‘real time’ months of inventory demonstrating larger increase in condo inventory and low levels of low-rise housing inventory.
18:30 – discussion around ‘Spring’ Market being pushed to the Summer months.
19:50 – Future new condo supply coming to market and how this will/might impact the condo segment (and possible negative impact without immigration due to Coronavirus).
25:56 – Mortgage Deferrals – Are they happening? Is this the elephant in the room we are avoiding?
28:28 – What about assignments of new condos? Are there desperate Sellers who are calling and needing to sell their new condominiums before completion due to job losses and the inability to obtain a mortgage?
