Brandon, Christian and Jason discuss the market dynamics and what is really happening in the downtown core. With the low-rise and high rise sector trending in different directions (as of September 2020), we’re bringing you the facts (and our opinions) on where we see the market headed.
To jump to the section of interest, please see the timeline specified below:
2:03 – Map showing districts/neighbourhoods during discussion points for graphs/charts and information in discussion.
2:47 – Toronto Real Estate Board Market Watch Overview. Discussion of key points of GTA wide market stats produced every month by TREB. Toronto’s unemployment rate, GDP Growth, Inflation and the prime interest rate are highlighted on this overview.
6:56 – Jason from Outline Financial comments on interest rates available (spoiler alert – less than 2% is widely available).
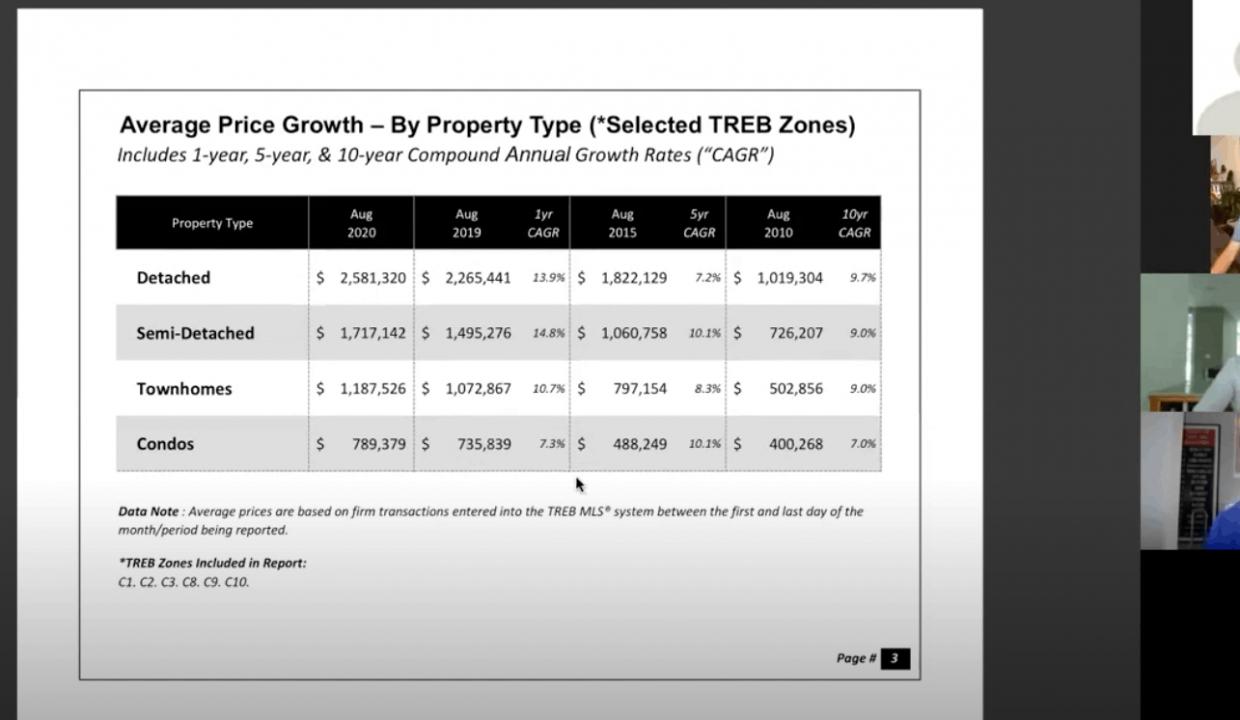
7:40 – Month versus month (August 2020 versus 2019 and 5/10 year comparisons) Average price growth (for all home types – Detached, Semi-Detached, Row/Townhouses and Condos).
8:27 – Rolling 12 month Average Price Growth (Detached, Semi-Detached, Row/Townhouses and Condos).
8:58 – Average Price Growth Graph showing the past 10 years of monthly and rolling 12 month Average Price Growth (Detached, Semi-Detached, Row/Townhouses and Condos).
10:45 – Number of Sales for the month of August 2020 versus 2019 and 5 & 10 year averages. Discussion centered on hypotheses for ‘why’ there is a surge in demand for low-rise versus high-rise properties.
12:45 – Number of New Listings chart showing new properties that came to market in August 2020.
13:00 – Number of Active Listings. This chart highlights the growing inventory in the high-rise sector (Condos) and how the large increase in condo inventory and lagging demand may result in a Buyer’s Market in the near future (in the downtown core, specifically for condos).
15:18 – 12 Month Rolling Average Months of Inventory Graph. Noticeable increase in the Condo sector was discussed in great detail and how we are clearly trending into a balanced market (and possibly Buyer’s Market) for Condos in the downtown core.
16:58 – Months of Inventory (For August 2020) showing that a Balanced Market (4.2 months of inventory) exists in the downtown core for Condos. All other housing types reflect a Seller’s Market for other housing types as of August 2020.
19:56 – Immigration chart showing levels of immigration.
20:22 – New Condo Completion schedule/chart (for the downtown core) showing inventory coming to completion over the next 12 months. Brandon discusses the impact of lower immigration, few international students and lagging demand and how this is pushing the market into Balanced Market territory (and continuing to shift in favour of Buyers).
22:50 – Rental Condo Supply is charted and discussed. The (almost) tripling of inventory is highlighted and how it is very much a ‘tenant’s market’ in the downtown core and that we anticipate more headwinds in the short term.
28:54 – Christian highlights the stats/figures/prices and months of inventory for Leslieville, Riverside, Riverdale and The Beach.
32:50 – Jason discusses mortgage interest rates, deferrals and options available for homeowners looking for alternatives.
